Volume Visualization
To date, scientists have used isocontours (eg. isomeshes and isosurfaces) to visualize volumetric structural data. While helpful, isocontours display only a fraction of the data, forcing scientists to scroll through several different isolevels to develop a full understanding of the volumetric data they are faced with. PyMOL's new volume visualization feature solves this problem by rendering all of the data at once.
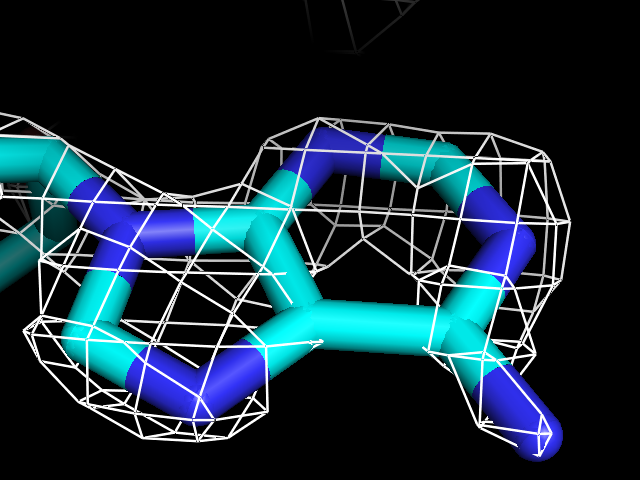
Without PyMOL Volume Visualization
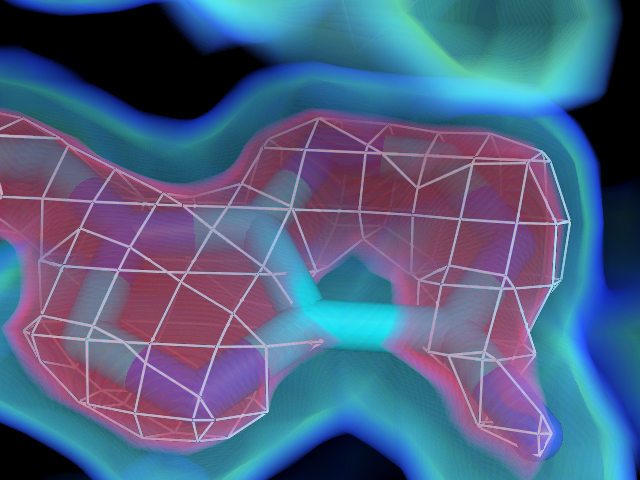
With PyMOL Volume Visualization
Above left, an isosurface corresponding to electron density at a given isolevel (+1 S.D.) is shown in mesh representation. Above right, the same isosurface is represented in red, with lower density data shown as a blue-green mixture.
Easily Differentiate Solvent and Protein
One application of the volume visualization feature is the separation of protein from solvent. Below left, electron density at an isolevel of 0.5 is shown in mesh representation. Using mesh representation alone, solvent cannot be easily differentiated from protein in this system. In contrast, the image at below right exploits PyMOL's volume visualization feature to represent high density regions (protein) as opaque red and low density regions (solvent) as transparent blue, making the true demarcations between protein and solvent immediately apparent.
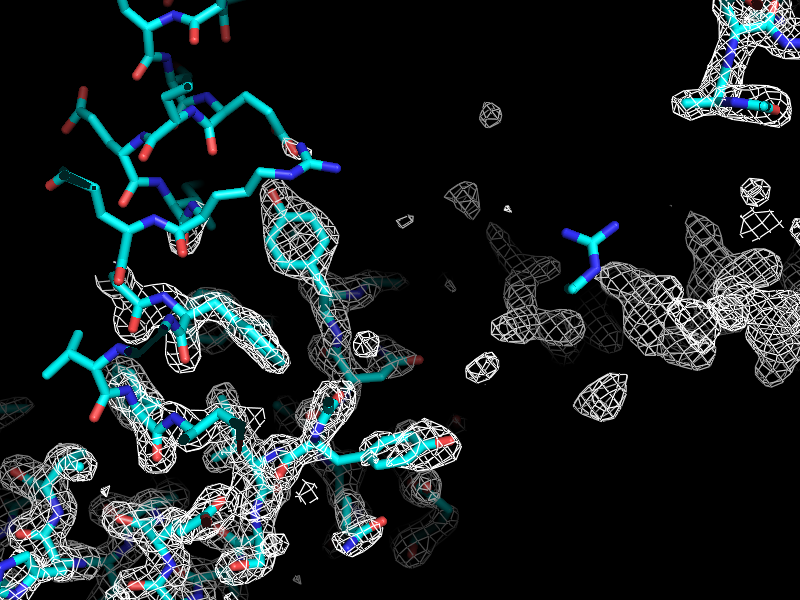
Without PyMOL Volume Visualization

With PyMOL Volume Visualization
Animate Any Type of 3D Data with Volume Visualization
This PyMOL volume visualization feature can also be used for electrostatic maps, grid scoring maps, Schrödinger WaterMap data, CT scans, and any other data that can be converted to a 3D map in O, CCP4, and XPLOR/CNS.
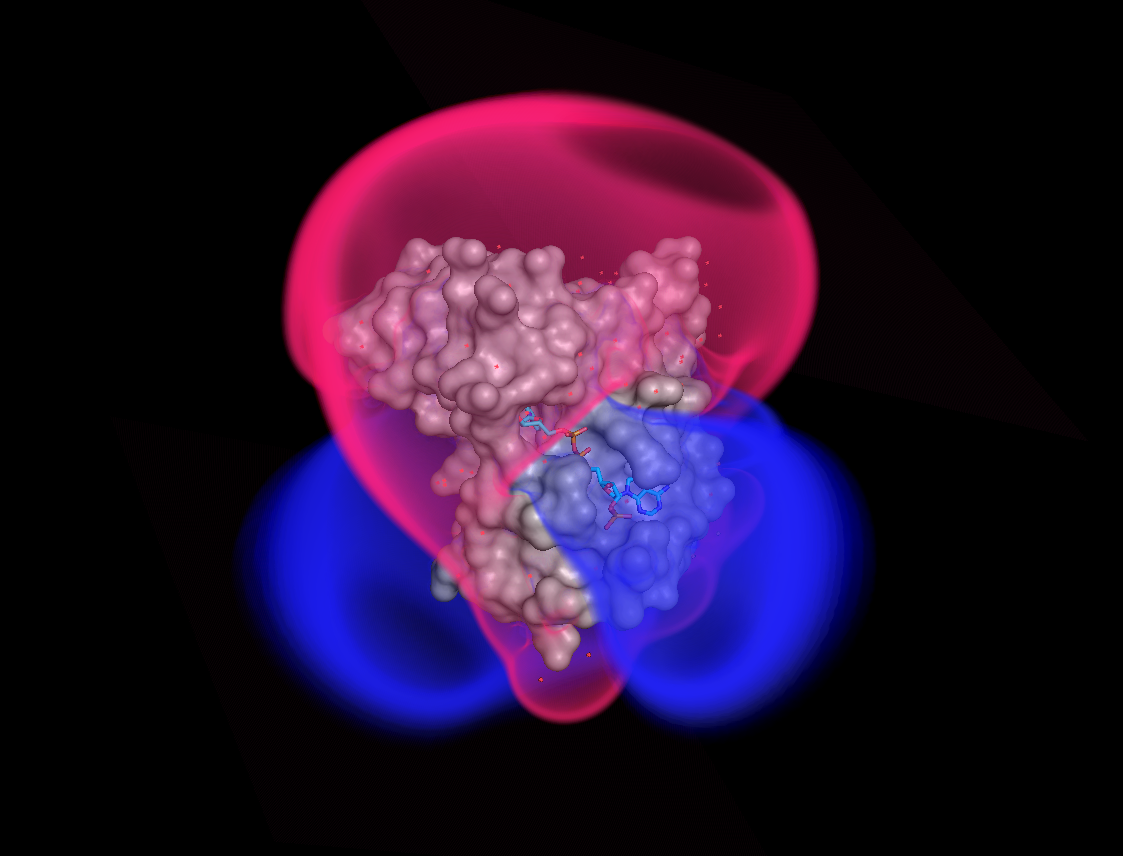
The charged volume of an electrostatic map, calculated using the PyMOL APBS plugin, is rendered in a transparent pink-to-yellow gradient.

A cutaway of a simulated hexamer is visualized at ~8-10 A resolution. 3 units are shown. (Data from Liam O'Ryan and The homology model of CFTR based on Sav1866 (Serohijos, Proc Natl Acad Sci U S A. 2008 Mar 4;105(9):3256-61))
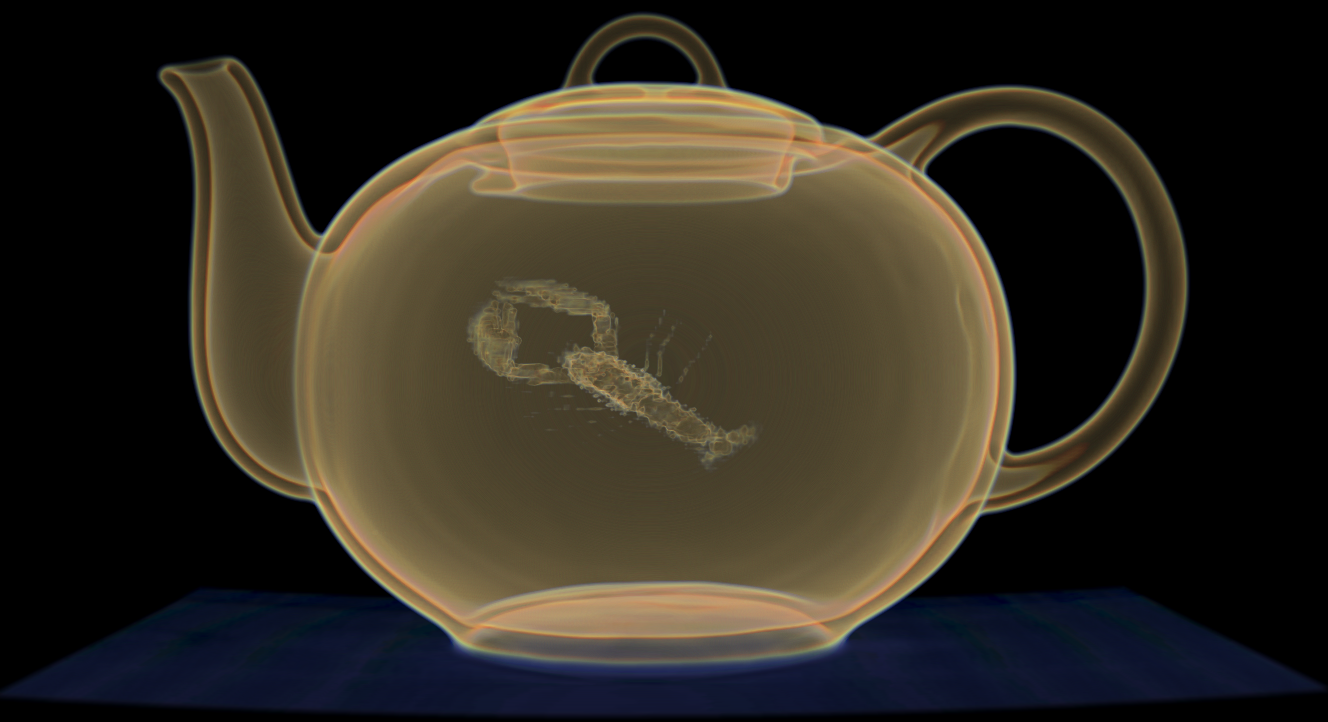
The Boston teapot dataset. The data show a teapot with a lobster inside.
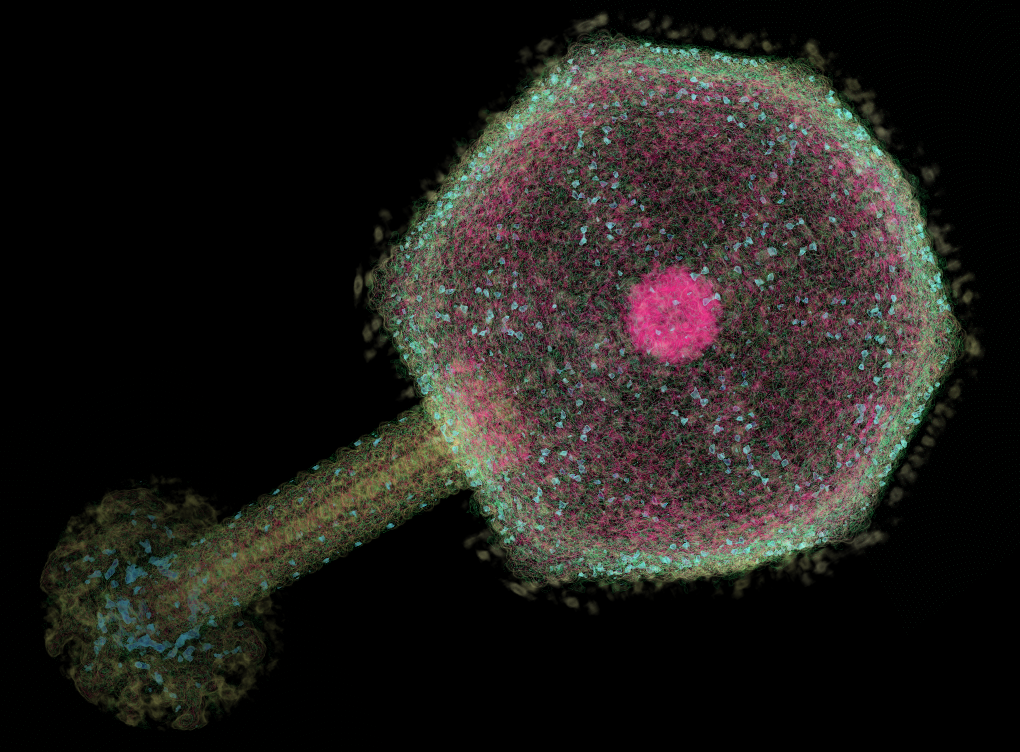
A phiKZ bacteriophage from electron microscopy data. The major axis is 3400 Angstroms long. PyMOL's performance allows a moderately powered laptop to visualize an entire virion 4000+ Angstroms on each side while achieving 30 frames/second.