Table of Contents
Position and Measurement
Now you might be interested in illuminating details of the molecular interaction between the protein and the ligand. You want to see potential H-bonds, distances, and so on.
Zoom
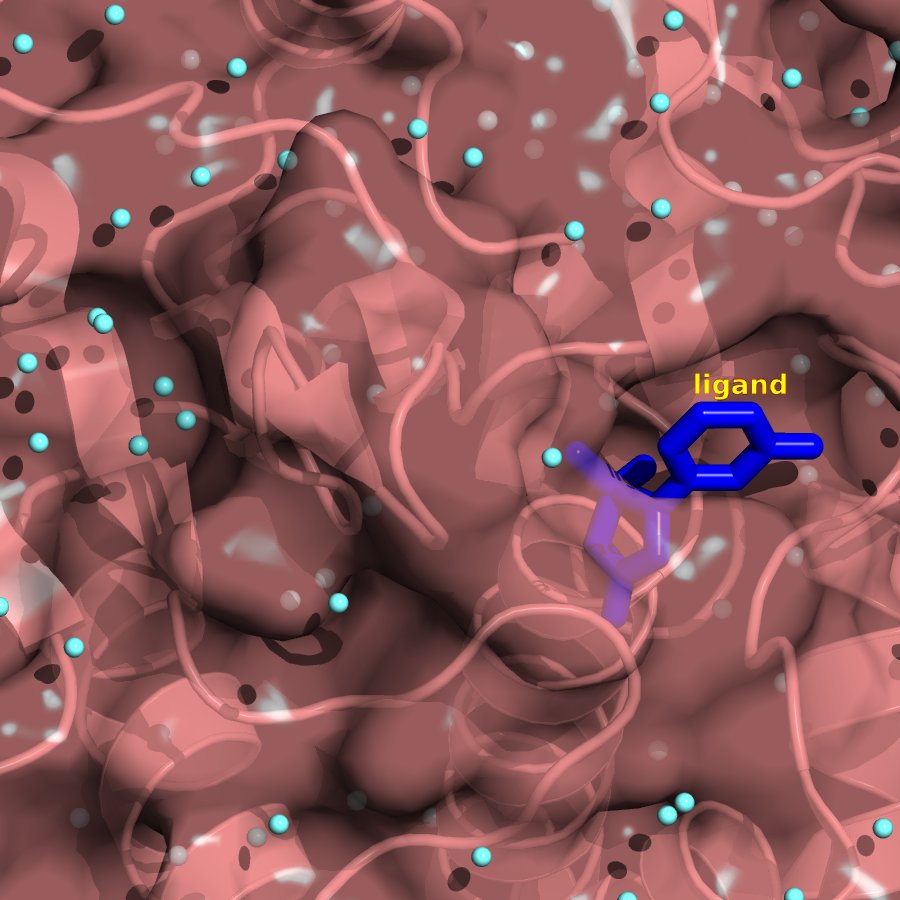
First, let's zoom in on the area of interest. This is easily done with the mouse controls. Holding down the right mouse buttons move the cursor toward you until the size of the ligand binding pocket looks like this:
Axes
Now again you can a command to move the pocket to the center of view. The image can be moved using changes in the cartisian cooridinates: [x,y,z]. To make this easier to see you can see how the axes are arranged in Pymol (NOTE GENERATE A NEW PIC - THIS ONE IS STOLEN):
Translation
So it is clear that if we want the binding pocket in the center of view we must move the protein/ligand object to the left or in the -x direction. This is done with this command:
translate [-10,0,0]
Doing a little more zooming and turning off the surface representation (hide surface) produces:
Add hydrogens
Where could H-bonds be formed? First it makes sense to measure some distances. A lot of PDB files don't come preloaded with hydrogens. You can add them automatically in pymol by typing:
h_add
Measure Distances
Typing this leads to some good measurements within the binding pocket. This shows all the potential hydrogen bonding distances from HO3 of the ligand to anything within 1.5 angstroms:
distance Hbond1, /2CM8//A/1299/H03,/2CM8////,1.5
Now try calling some of these H-bonds. Let's make little dashed lines to represent little H-bonds. Add this to your script or type it into the command line of pymol:


